搭建filebeat+redis+logstash+es+kibana架构,拓扑图参考ELK(3)
(1)准备安装和数据目录
[root@es ~]# mkdir -p /opt/redis_cluster/redis_6379/{conf,logs,pid}
(2)下载redis安装包
这里我已经提前下载好了,所以直接跳过此步。如没有安装包执行下面命名下载。
wget http://download.redis.io/releases/redis-5.0.7.tar.gz
(3)解压redis到/opt/redis_cluster/
1. [root@es ~]# tar zxf /media/redis-5.0.7.tar.gz -C /opt/redis_cluster/ 2. [root@es ~]# ln -s /opt/redis_cluster/redis-5.0.7 /opt/redis_cluster/redis
(4)切换目录安装redis
1. [root@es ~]# cd /opt/redis_cluster/redis 2. [root@es redis]# make && make install
(5)编写配置文件
1. [root@es redis]# vim /opt/redis_cluster/redis_6379/conf/6379.conf 2. 添加: 3. bind 127.0.0.1 192.168.8.1 4. port 6379 5. daemonize yes 6. pidfile /opt/redis_cluster/redis_6379/pid/redis_6379.pid 7. logfile /opt/redis_cluster/redis_6379/logs/redis_6379.log 8. databases 16 9. dbfilename redis.rdb 10. dir /opt/redis_cluster/redis_6379
(6)启动当前redis服务
[root@es redis]# redis-server /opt/redis_cluster/redis_6379/conf/6379.conf
(参考文档:https://www.elastic.co/guide/en/beats/filebeat/6.6/index.html)
(1)修改filebeat配置output指向redis,重启
1. [root@web ~]# vim /etc/filebeat/filebeat.yml 2. filebeat.inputs: 3. - type: log 4. enabled: true 5. paths: 6. - /var/log/nginx/access.log 7. json.keys_under_root: true 8. json.overwrite_keys: true 9. tags: ["access"] 10. 11. - type: log 12. enabled: true 13. paths: 14. - /var/log/nginx/error.log 15. tags: ["error"] 16. 17. setup.template.settings: 18. index.number_of_shards: 3 19. 20. setup.kibana: 21. 22. output.redis: 23. hosts: ["192.168.8.1"] //指向redis地址 24. key: "filebeat" 25. db: 0 26. timeout: 5 27. [root@web ~]# systemctl restart filebeat
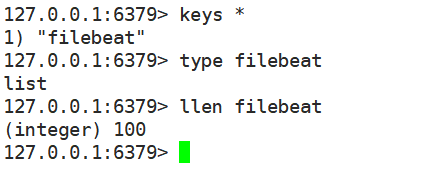
(2)es主机测试访问网站,登录redis,查看键值
测试前需要先用client主机ab工具发出请求,而后使用redis命令查看。
[root@client ~]# ab -n 100 -c 20 http://192.168.8.2/index.html
redis-cli #登录keys * #列出所有键type filebeat #filebeat为键值名LLEN filebeat #查看list长度LRANGE filebeat 0 -1 #查看list所有内容
(1)安装logstash
[root@es ~]# rpm -ivh /media/elk-6.6/logstash-6.6.0.rpm
(2)配置logstash
1. [root@es ~]# vim /etc/logstash/conf.d/redis.conf 2. 添加: 3. input { 4. redis { 5. host => "192.168.8.1" 6. port => "6379" 7. db => "0" 8. key => "filebeat" 9. data_type => "list" 10. } 11. } 12. 13. filter { 14. mutate { 15. convert => ["upstream_time","float"] 16. convert => ["request_time","float"] 17. } 18. } 19. 20. output { 21. stdout {} 22. elasticsearch { 23. hosts => ["http://192.168.8.1:9200"] 24. index => "nginx_access-%{+YYYY.MM.dd}" 25. manage_template => false 26. } 27. }
(3)启动logstash
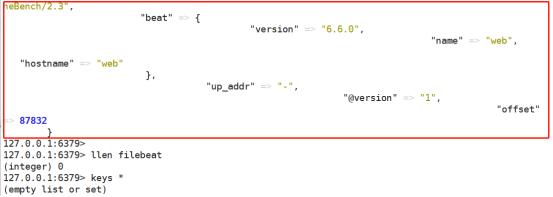
执行下面命令后,redis中的数据将会被取走。
[root@es ~]# /usr/share/logstash/bin/logstash -f /etc/logstash/conf.d/redis.conf &
下图中看到先执行llen命令,可以看到数据还存在,稍等片刻等待被取走,出现红框中的内容后,再次查看,数据已经被取走了。
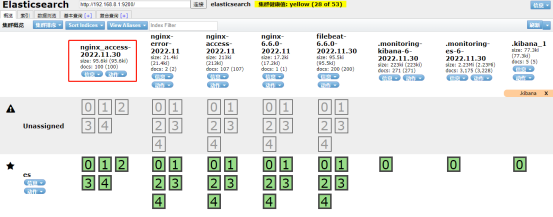
(4)修改logstash配置文件,实现access和error日志分离
1. [root@es ~]# vim /etc/logstash/conf.d/redis.conf 2. 添加: 3. input { 4. redis { 5. host => "192.168.8.1" 6. port => "6379" 7. db => "0" 8. key => "filebeat" 9. data_type => "list" 10. } 11. } 12. 13. filter { 14. mutate { 15. convert => ["upstream_time","float"] 16. convert => ["request_time","float"] 17. } 18. } 19. 20. output { 21. stdout {} 22. if "access" in [tags] { 23. elasticsearch { 24. hosts => ["http://192.168.8.1:9200"] 25. index => "nginx_access-%{+YYYY.MM.dd}" 26. manage_template => false 27. } 28. } 29. if "error" in [tags] { 30. elasticsearch { 31. hosts => ["http://192.168.8.1:9200"] 32. index => "nginx_error-%{+YYYY.MM.dd}" 33. manage_template => false 34. } 35. } 36. } 37. [root@es ~]# /usr/share/logstash/bin/logstash -f /etc/logstash/conf.d/redis.conf &
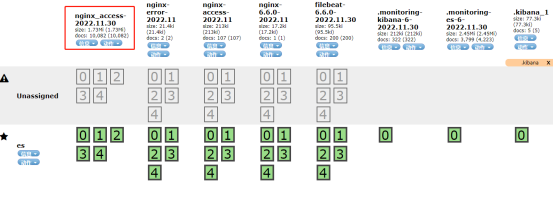
启动后在client主机创建多个连接数测试,刷新elasticsearch查看请求数量(数量较多,稍等片刻)。
[root@client ~]# ab -n 10000 -c 1000 http://192.168.8.2/index.html
Copyright © 2023 leiyu.cn. All Rights Reserved. 磊宇云计算 版权所有 许可证编号:B1-20233142/B2-20230630 山东磊宇云计算有限公司 鲁ICP备2020045424号
磊宇云计算致力于以最 “绿色节能” 的方式,让每一位上云的客户成为全球绿色节能和降低碳排放的贡献者